Simulation Report 
![]()
![]()
Access: Invoke the Machine or Material Removal Simulator and select Simulation Report from the Simulator Guide.
Provides information about the simulated procedures and any problems detected during the simulation, whether related to collision between machine components or problems related to material removal.
The Simulation Report dialog is similar to the Motions List dialog. The principal differences are that the Simulation Report shows just the problematic blocks.
The functionality in both the dialogs (Simulation Report and the Motions List) is the same.
The procedures are displayed in the upper pane. Selecting a procedure will show its relevant motion and show the relevant cutter in position of the first block of the selected procedure. Selecting any block from the list will position the tool in the appropriate position. Clicking the up/down keyboard arrows advances the tool accordingly.
The lower pane displays the Description column that shows the geometries involved in the collision or gouge along with several more parameters.
See Also
Machine Simulator – Simulation Report dialog
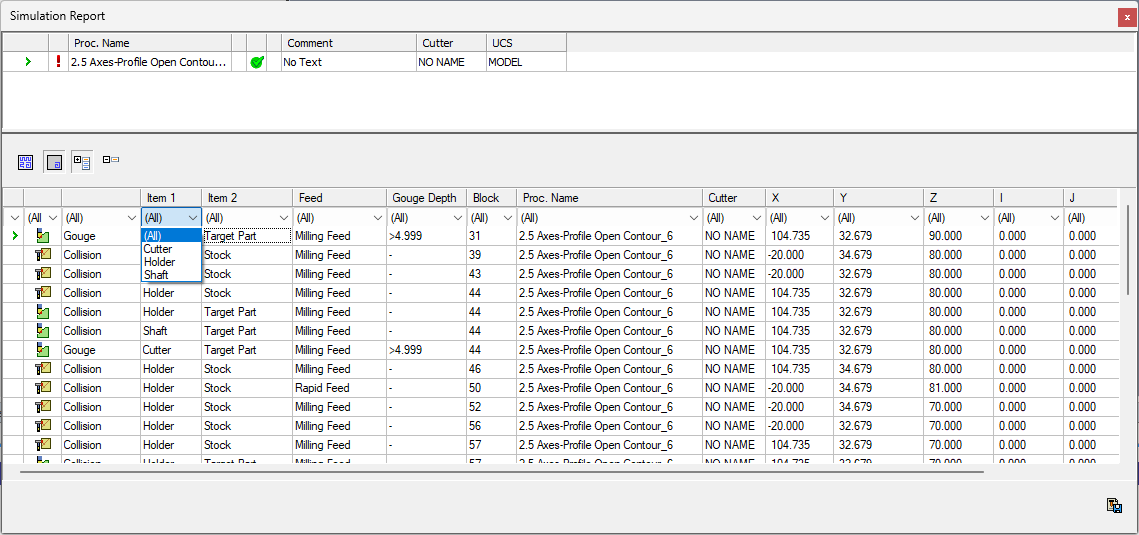
The Machine Simulator's Simulation Report dialog is shown below. .
|
|
See: |
Report Result Filtering
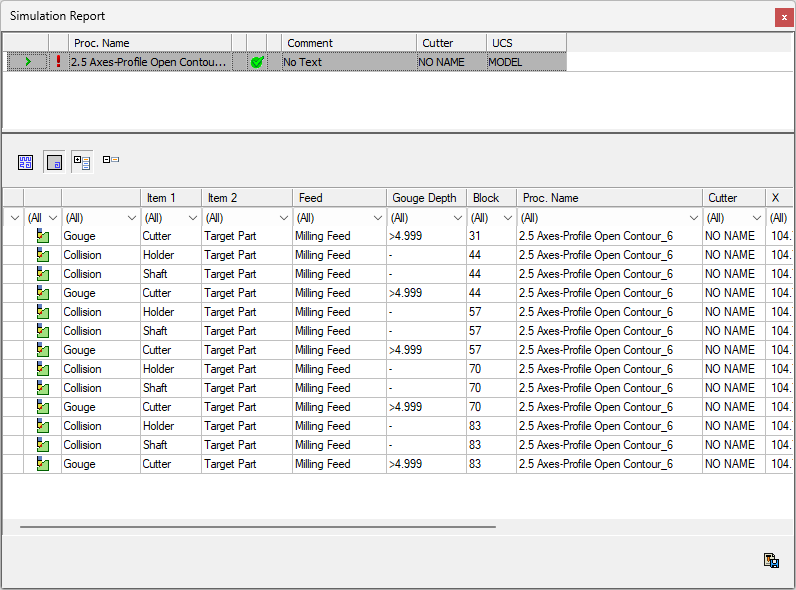
Filters are available at the top of each column that can control which of the detected errors are displayed.
The following options can be configured;
The error type, such as Gouge, Collision, Machine Limits.
The colliding element, such as cutter, shaft, shank, holder, spindle.
The collided element, such as stock, target part, fixture, other, machine.
The Motion Feed, such as Rapid, Milling.
The Gouge Depth, using specific values or a range.
The Block, using specific values or a range.
The procedure name.
The cutter name.
Range selection
If you select the Range option available on some filters, a second dialog is displayed, enabling you to enter a pair of values representing the lower and upper values of the range.
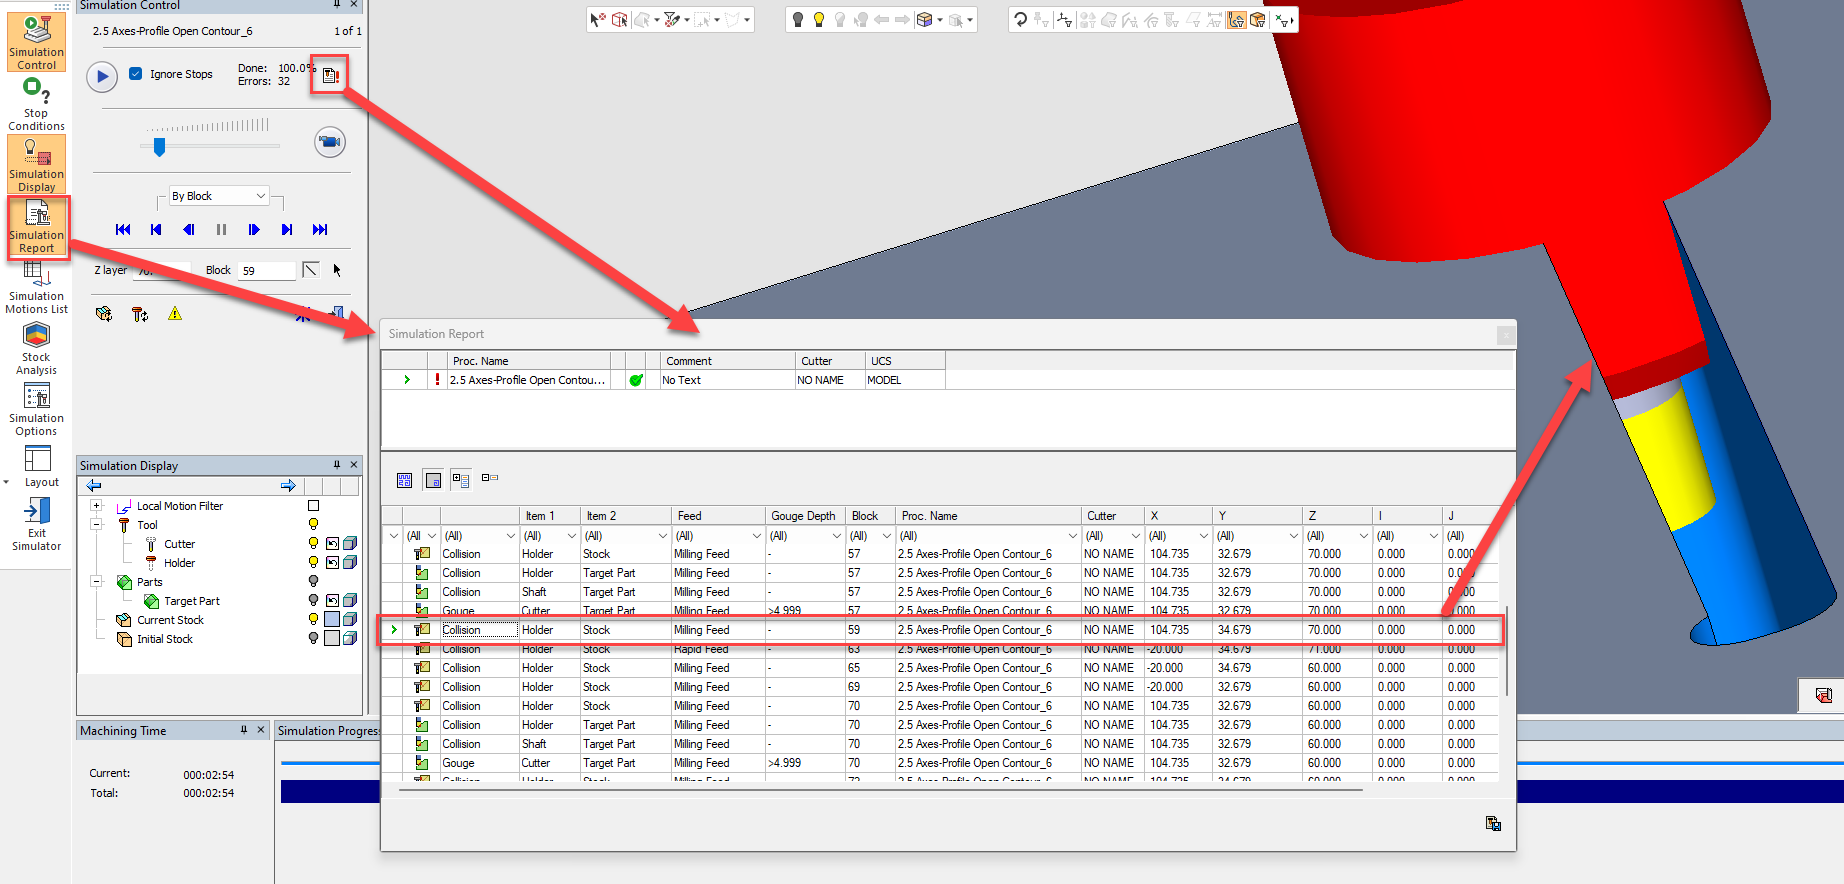
Usage example
The image below shows Simulation Report dialog in use. In this example the dialog shows that in block #59 the Holder collides with the Stock.
Simulation Report Dialog Parameters
1 |
The top pane contains a list of all the procedures that were selected to be simulated. For each procedure, there is information about its name, comment, cutter, UCS, and the procedure status flag, as appears in the NC Process Manager. |
||||||||||||||||||||
2 |
The symbol to the left of each procedure indicates simulation states.
|
||||||||||||||||||||
3 |
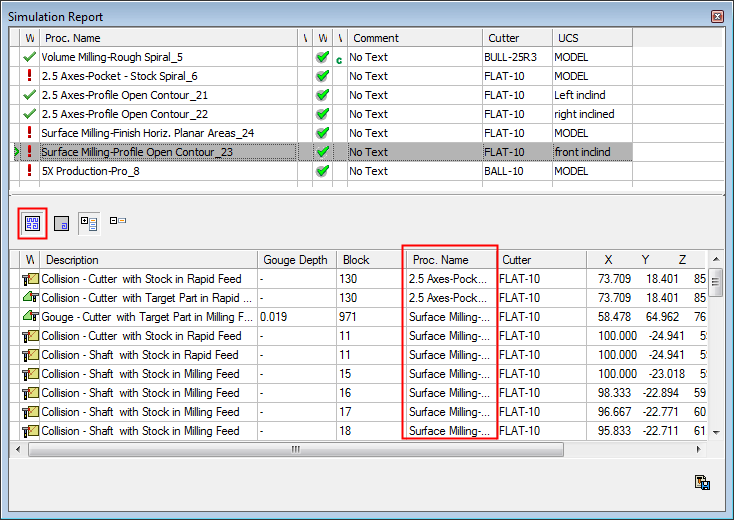
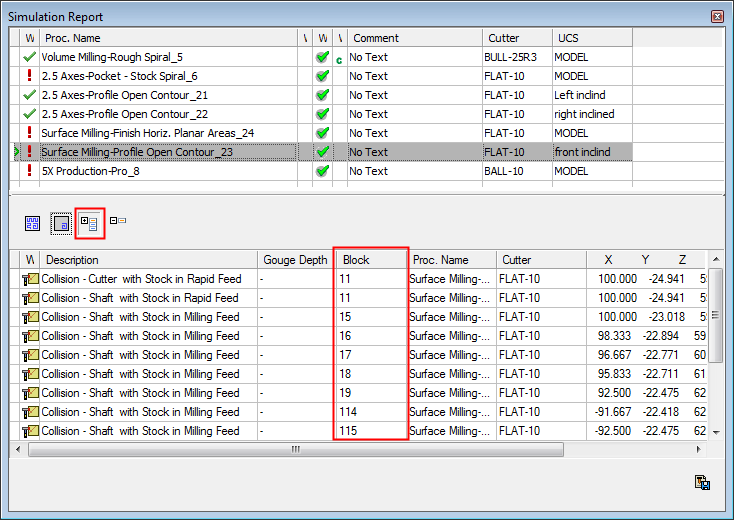
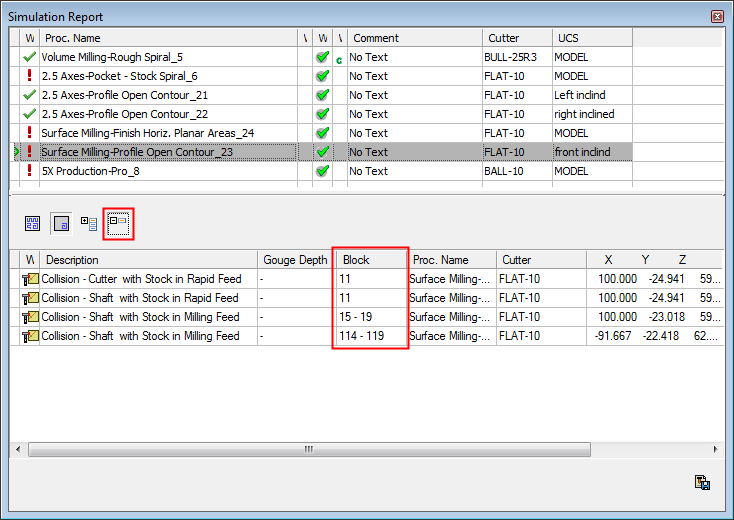
The following buttons are displayed below the procedure list.
|
||||||||||||||||||||
4 |
The bottom pane of the report dialog contains a list of the problematic blocks that were found. It shows only the problems for the selected procedure that is highlighted and marked |
||||||||||||||||||||
5 |
On the left side of each problematic block there is an icon which indicates the problem type. The description in the column on the right explains the nature of the problem. |
||||||||||||||||||||
6 |
Below each column header is a drop-down list Filters that are active (All is not selected) are highlighted in yellow. The filter options for each column headers are listed below. Select the filter criteria for each header column as needed and click OK to apply your selection. All is the default filter option.
|
||||||||||||||||||||
7 |
If the target part is gouged, the Gouge Depth column shows the depth of detected gouge. No depth is specified if it is a collision with elements that are not the target part. |
||||||||||||||||||||
8 |
On the bottom right of the report dialog, the Save Simulation Report button |