Deviation Map  : Options and Results

Access: Open this function from the following location:
-
Select Analysis > Main Tools > Deviation Map from the menu bar.
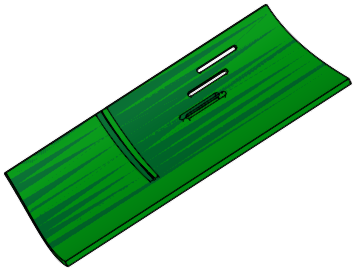
Calculate the deviation between two versions of a part, or the interference between a part and a selected set of items.
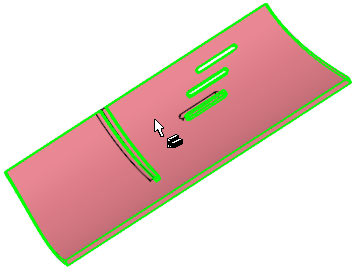
The result is a color-coded map of the distances between the original and target parts.
- Deviation Map can be used to find out how much material has been added or removed between two versions of a part.
- Prior to using the Deviation Map, overlay the new part on the old one by either adding it to the assembly or importing it. The results of the analysis are presented using a color-coded display. A mouse click in a specific area will display the distance between walls and other features. For more, see Analysing two versions of the same part.
- It can also be used to highlight the interference between one part and many other intersecting items. For more, see Testing for interference between parts.
Analysing two versions of the same part
Required Step 1 
Pick the original object or face(s) and then <exit><exit>. A single object or a group of faces from the same body can be selected. If an object is selected, the system automatically switches to the next step.
Required Step 2
Pick the target object or face(s) and then <exit><exit>. A single object or a group of faces from the same body can be selected. If an object is selected, the system automatically switches to the next step.
Note: If faces were selected in Step 1, they should not be selected in Step 2.
Required Step 3 
Set the parameters on which the analysis is to be based. The following parameters are displayed, see the parameters table below for more:
|
|
|
Testing for interference between parts
Required Step 1
Pick the original object; The system automatically moves to the next step.
Required Step 2
Pick one or more target objects and then <exit><exit>.
Required Step 3
Set the parameters on which the analysis is to be based. See the parameters table below for more.
|
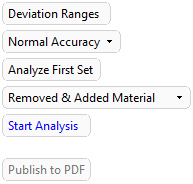
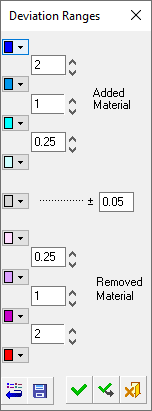
Deviation Ranges |
Displays a dialog showing color-coded deviation ranges.
|
||||||||||||
|
Normal Accuracy |
Select the accuracy level of the analysis. The available options are Low Accuracy, Normal Accuracy and High Accuracy. |
||||||||||||
|
Analyze First Set |
Switch between Analyze First Set and Analyze Second Set to define which set displays the analysis mapping with respect to the other set. The first set is the object or faces select in step 1 and the second set is the object or faces selected in step 2. |
||||||||||||
|
Removed & Added Material |
Select how the color-coded analysis is displayed:
|
||||||||||||
|
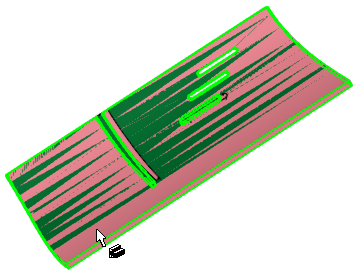
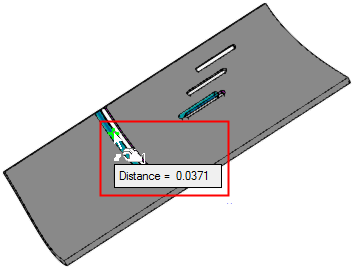
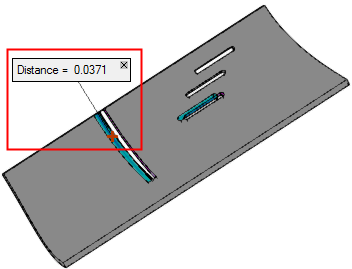
Start Analysis |
Perform the analysis based on the current parameter settings. When analysis is complete, you can move the cursor over areas of the body where color-coded analysis is shown to see the analysis result for each area. Pick a point to attach a label displaying the analysis result at that point.
|
||||||||||||
|
Publish to PDF |
Publish to PDF to create 3D PDF files that include parts and assemblies from Cimatron. When the Publish to PDF button is selected, a dialog is displayed giving you additional controls before the selected entities are exported to PDF. The Publish to PDF button is
available after an analysis is run (Start
Analysis) and enables you to print the results of the analysis.
The PDF report is titled Deviation Map Report and below the visual area, the color-coded map and distance ranges are displayed. |
When finished, press Exit ![]() in the Feature Guide to complete the function.
in the Feature Guide to complete the function.