|
|
Entity Information 

Access: Open this function from the following location:
-
Select Analysis > Tools > Entity Information from the menu bar.
Show different information about the selected entity.
The tool displays geometrical information and detects problematic areas. No geometrical entities are created; all visual information (control points, break points, etc.) are cleared after exiting the function. Entity Information does not use the regular selection filter while entity selection is available in NC after the Entity Information tool is invoked.
Upon invoking the function, a special cursor icon is displayed  . The dialog displayed after picking the particular entity is specific to the entity type picked. You can move from one entity to another and the dialog updates accordingly. Clicking the middle mouse button exits the function.
Each specific entity dialog contains three management buttons for producing full and short reports and for selecting a new entity.
The following entity types can be analyzed:
Interaction
-
Pick an entity and the appropriate Entity Information dialog is displayed showing the relevant geometrical information. The geometric data being analyzed is displayed at the top of the dialog.
|
|
|
-
Use the Check curvature button to check the minimum and maximum curvature of the picked entity.
|
Data before Check curvature is pressed. |
Data after Check curvature is pressed. |
|
|
|
-
In the Show section of the dialog, visual information relevant to the picked entity can be displayed. Entity colors can be redefined by clicking on the color square and accessing the Color Palettes.
|
|
|
|
|
|
|
|
|
|
All the Show information can be displayed together: |
|
|
|
|
-
A short and or full report can be produced as txt files:
Short Report
|
|
|
Full Report
|
|
|
-
To analyze another entity, press the New entity button and then pick the required entity.
Curve
Examples using the following geometrical information:
Control Points, Knots and Slopes
Entity colors can be redefined by clicking on the color square and accessing the Color Palettes.
Break Points
Entity colors can be redefined by clicking on the color square and accessing the Color Palettes.
Free ends, Start point
Entity colors can be redefined by clicking on the color square and accessing the Color Palettes.
Edge
Examples using the following geometrical information:
Control Points, Knots, Faces and Slopes
Entity colors can be redefined by clicking on the color square and accessing the Color Palettes.
Slope at Selected Point and Normal at Selected Point

Entity colors can be redefined by clicking on the color square and accessing the Color Palettes.
Face
Examples using the following geometrical information:
Control Points and Outside Direction
Entity colors can be redefined by clicking on the color square and accessing the Color Palettes.
Normal at Selected Point
Entity colors can be redefined by clicking on the color square and accessing the Color Palettes.
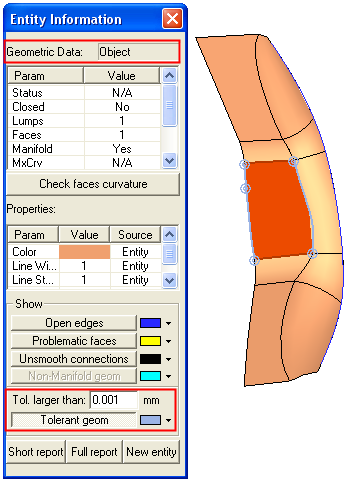
Object
Examples using the following geometrical information:
Open Edges

Entity colors can be redefined by clicking on the color square and accessing the Color Palettes.
Tolerant Edges/Vertices
Entity colors can be redefined by clicking on the color square and accessing the Color Palettes.
|
Tol. larger than: |
Display tolerant geometry which is equal to or larger than the defined
value. This value is entered in mm (even in an inch file) and is the minimum
tolerant geometry (of edges/vertices) that is to be displayed. Tolerant
geometry with a tolerant data/value which is smaller than the entered
value, is not displayed.
Default value: 0.001 Minimum value: 0.000001 Maximum value: 10 If tolerant geometry does not exist in the selected body, an appropriate message is displayed. |
Unsmooth connections
Entity colors can be redefined by clicking on the color square and accessing the Color Palettes. In this case, the default black was changed to green for additional clarity.
Non-Manifold Geometry
Non-Manifold Geometry (also known as Zero-Thickness Geometry) exists when edges or vertices in a solid model are not properly connected with adjacent geometry. An example of non-manifold geometry is where an edge has more than two adjacent faces. Non-manifold geometry is problematic and can cause errors in the model.
Manifold geometry is where the geometry is well defined. It has the following properties (among others):
-
Every edge has two adjacent faces.
-
Every vertex is surrounded by one sequence of edges and faces.
When checking the geometric data of objects, the Manifold parameter is included in the parameter results list. If the result is Yes (see the examples above), then the object is manifold and the Non-Manifold geom button is grayed out. If the result is No, then the object is non-manifold and the Non-Manifold geom button is available to determine the location of the problematic geometry.
In this example, a non-manifold tangent and edge have been detected.
In this example, a non-manifold tangent has been detected.
In this example, a non-manifold vertex has been detected.
Entity colors can be redefined by clicking on the color square and accessing the Color Palettes.
Sketch
Examples using the following geometrical information:
Connection Break points, Free ends and Start point
Entity colors can be redefined by clicking on the color square and accessing the Color Palettes.
Intersection points, Free ends and Start point
Entity colors can be redefined by clicking on the color square and accessing the Color Palettes.
Toolpath
Entity colors can be redefined by clicking on the color square and accessing the Color Palettes.
|