|
|
On Machine Inspection  : Inspection Report

Access: Open this function from one of the following locations:
-
Select NC Process > Procedure Operations > Inspection Report from the menu bar.
-
When an On Machine Inspection procedure is selected, right-click in the Process Manager (or anywhere in the graphics window when no procedure is active) and select Inspection Report from the popup menu.
As part of the On Machine Inspection procedure process after the measurement results have been imported, create an inspection report. The report may be produced in Excel and 3D PDF formats (both formats can be created simultaneously).
A typical On Machine Inspection procedure scenario involves the following:
-
The On Machine Inspection procedure creates measurement motions in Cimatron that are posted to the CNC machine.
-
The measurements are executed on the machine.
-
The measurements results are imported from the CNC controller back to Cimatron and associated with the On Machine Inspection procedure.
-
An inspection report of the measurement results is created.
When this function is usedused, the measurement results imported by the Import Measurement Results function are displayed in the graphics window and on a table in the Inspection Report dialog (see below). Reports may then be produced in the available export formats.
|
|
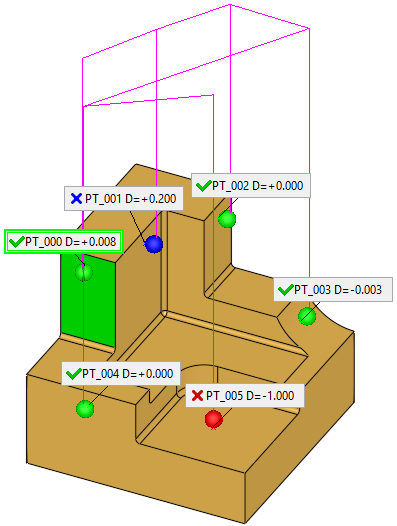
The inspection probes (shown as spheres with the same diameter as the probe tool) are displayed at the result points. A point is created at the probe touch point and each measurement point is labeled. The imported measurement results are displayed color-coded on the part (the spheres and label status) and in the Inspection Report dialog (Status column) (see below). The color codes may be GREEN, RED, or BLUE.
Labels are used in the graphics window to name a probe point, display its status, and show the deviation at that point. This information also appears in the Inspection Report dialog (see below.) The Status may either be The visibility of the probes and labels is controlled from the Inspection Report dialog (see below). The label names are automatically defined in the On Machine Inspection procedure. The automatic name consists of 2 letters from the cycle type plus the ordering number (for example, PT_034 for the Point cycle type). Edit the label names as required while editing the procedure. |
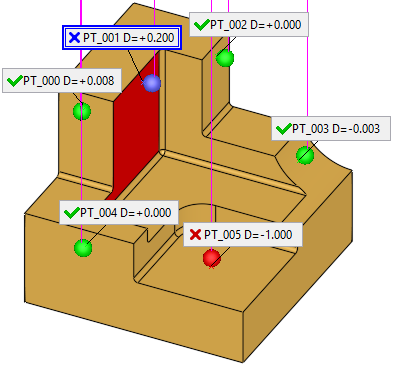
 (if the result is OK) or
  /
/  , as per the color-coding.
Clicking on a label or sphere highlights the relevant surface and also the relevant row in the Inspection Report dialog, and vice versa. The relevant surface is displayed either in GREEN (all is OK), RED (something is not OK), or YELLOW (mixed results).
|
|
|
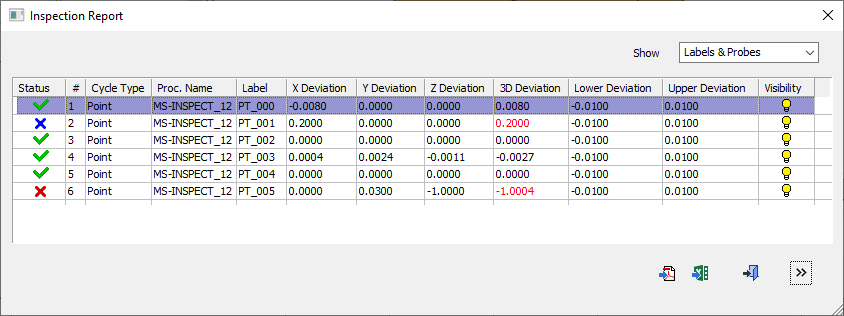
Inspection Report dialog
The Inspection Report dialog is displayed. This dialog may be displayed in collapsed or expanded mode with the latter showing additional information.
Inspection Report dialog collapsed
Inspection Report dialog expanded
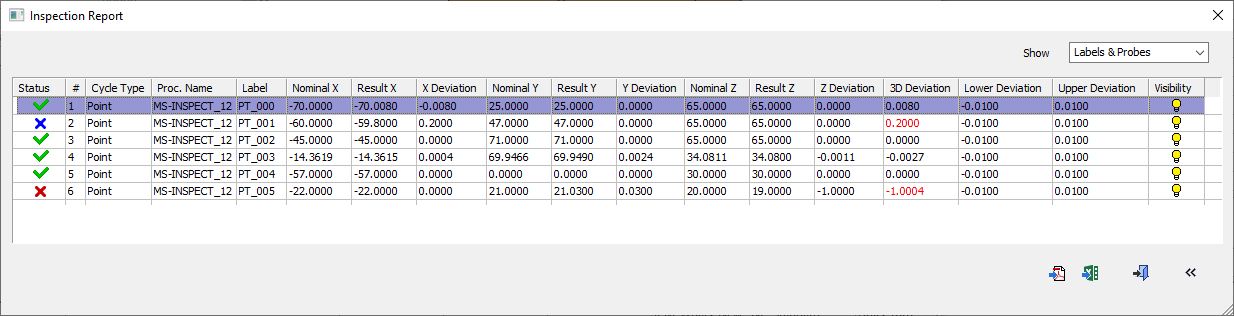
Columns
|
Status |
This column displays the status of the measurement results. This status refers to the amount of deviation from the Upper/Lower Tolerance values set for the measurement and updated when the tolerances are changed. The status symbols are color-coded. Available options are shown below.
|
|
Serial # |
Serial number |
|
Cycle Type |
Displays the measurement cycle type |
|
Procedure Name |
The name of the On Machine Inspection procedure |
|
Label |
The label number (see the image above) |
|
Nominal X, Y, Z |
Three columns for each of the X, Y, Z axes that specify the Nominal, the Result, and the Deviation coordinates for each axis. The Nominal and Result values are not displayed in the collapsed dialog. |
|
Result X, Y, Z |
|
|
Deviation X, Y, Z |
|
|
3D Deviation |
Shows the deviation from the Nominal position. If a value is out of tolerance, the value is colored RED. These values appear in the expanded dialog. |
|
Lower Deviation |
The lower and upper deviation limits from the procedure parameters. These values appear in the expanded dialog. |
|
Upper Deviation |
|
|
Visibility |
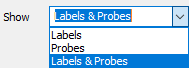
Hide or show the relevant labels and probes (spheres) on the geometry screen. The Show option above the table controls the visibility of all labels and/or probes.
|
Dialog buttons
The following buttons are in the dialog
|
|
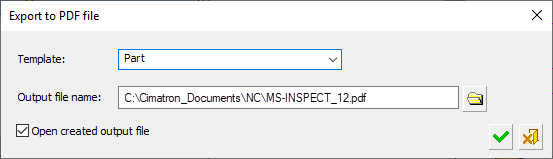
Export the result to a PDF file. Clicking on the PDF icon opens a dialog that creates the PDF format file report.
|
||||||
|
|
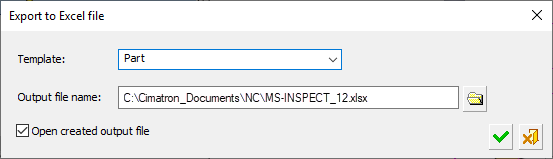
Export the result to an Excel file. Clicking on the Excel icon opens a dialog that creates the Excel format file report.
|
||||||
|
|
Exit: Exit the operation and close the dialog/task. |
||||||
|
|
Expand Expand or collapse the dialog. |


|