|
|
Information Tool: Additional Data 

Access: Open this function from the following location:
-
Select Analysis > Tools > Information from the menu bar.
Display tooltip information about the selected entities.
The following additional High Level Information data can be displayed:
Accumulative Data
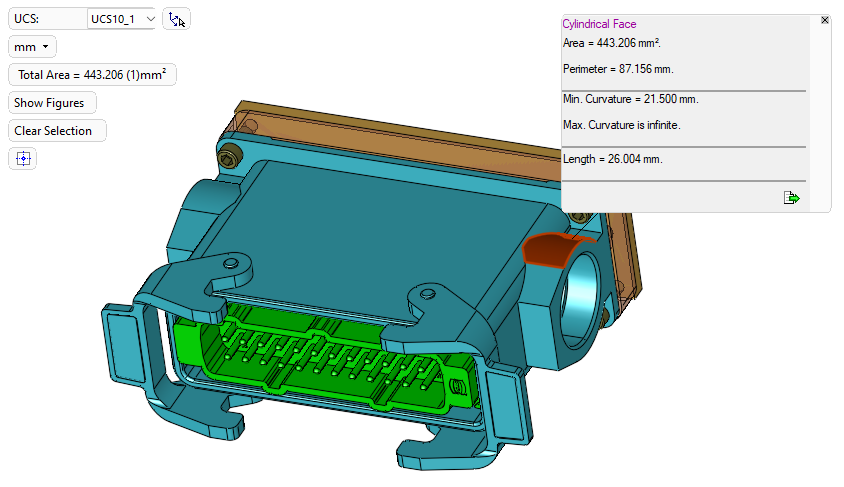
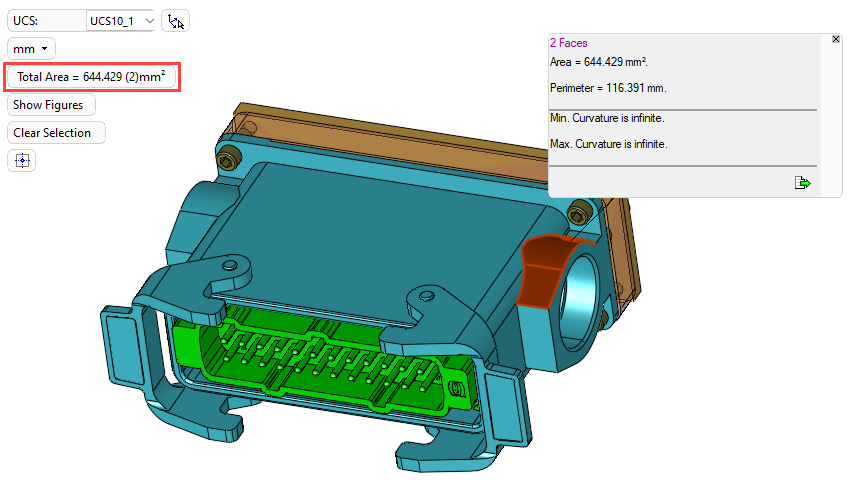
The Information Tool displays accumulative data. Each picked entity displays an information dialog showing the entity information. When another entity is picked, the system displays the accumulative information of both entities, as shown below.
An entity is picked and the information dialog is displayed:
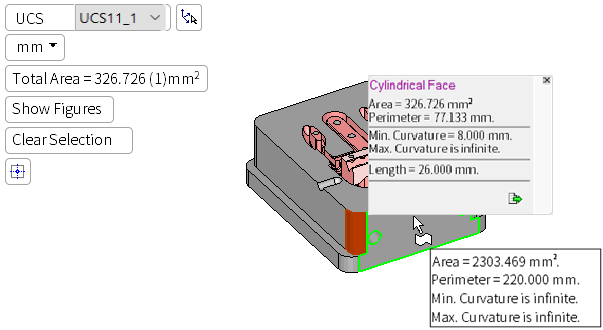
Another entity is picked:Another entity is picked:
The information dialog now displays the accumulative data on both the picked entities. Note that the Total Area field has also been updated.
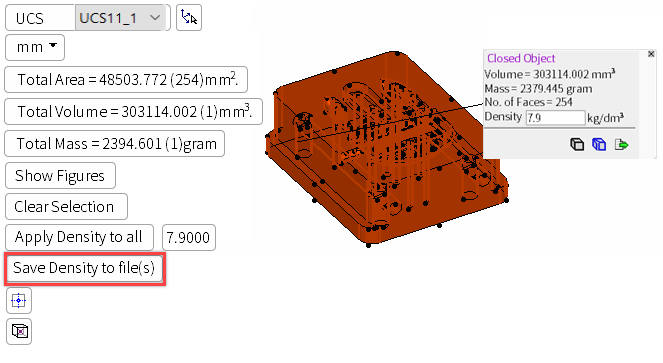
Entire Object
The entire object can be picked.
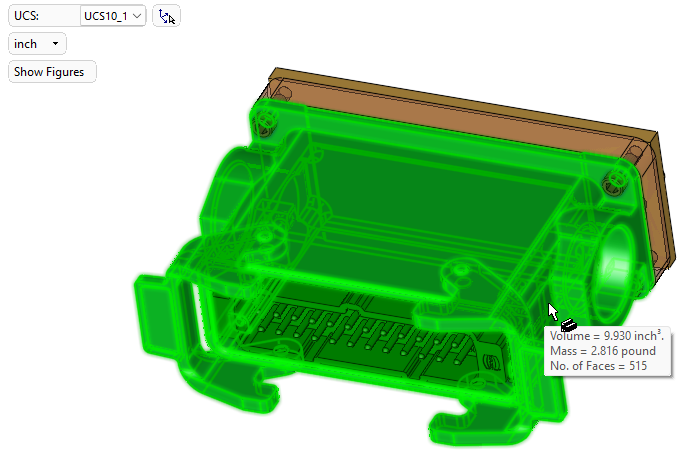
The following data is displayed:
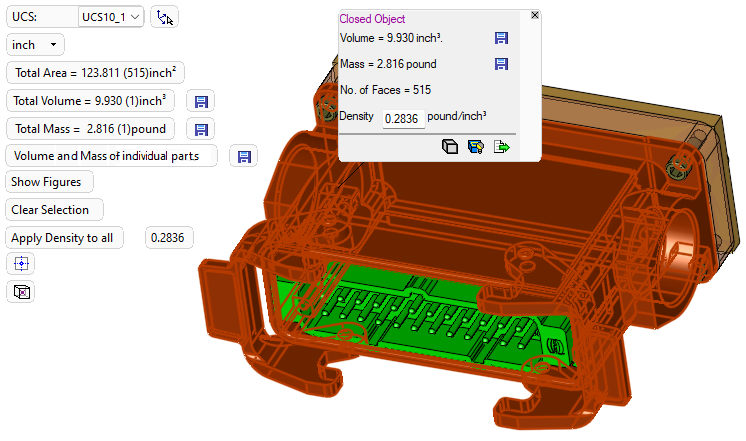
Picking an object displays the following additional data:
Additional buttons appear in the pop-up dialog:
|
|
This toggle button hides and shows unsmoothed connections, if there are any.
|
|
|
This toggle button hides and shows open edges, if there are any. |
|
|
Save the associated value (mass or volume) of a closed object to the file attributes for that part (The button remains highlighted after a successful save). |

Additional parameters are displayed in the parameter area: Total Volume, Total Mass, and Apply Density to all.
|
Total Volume/Total Mass |
The parameter value can be added to the file properties. Click the save to the file Attributes button
Note: This value is immediately visible in File > File Tools > Properties, but it is only written to the properties dialog visible in File > Open when the model is saved. |
||
|
Volume and Mass of individual parts |
Displayed when multiple parts have been selected in an active assembly Note: The Volume and Mass calculations for open objects are calculated and displayed in red along with the double-tilde (») symbol to highlight they are approximate figures. |
||
|
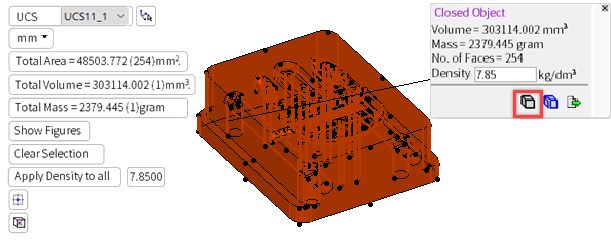
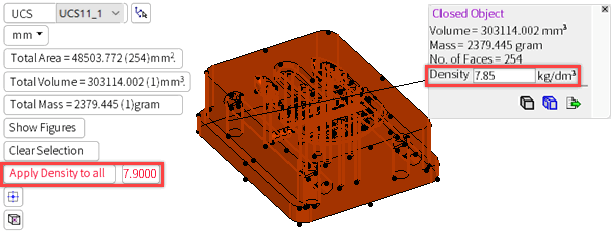
Apply Density to all |
The Density information is acquired from the Density attribute in the file properties. If you change a density value, either by editing the main density screen parameter, or by changing the density of a specific figure, the Apply Density to all parameter is displayed in red to indicate that there is a mismatch between these two figures.
The density value for the whole component can be changed by entering the required value (in the main density screen parameter) and pressing the Apply Density to all button.
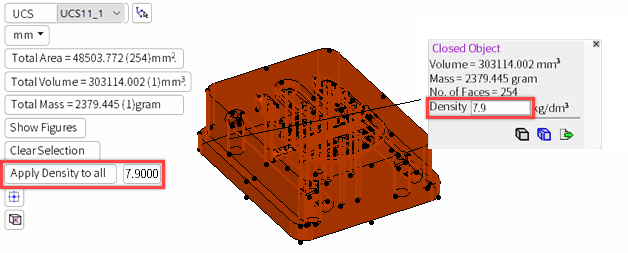
When the Apply Density to all button is pressed, an additional parameter is displayed:
Note: This value is immediately visible in File > File Tools > Properties, but it is only written to the properties dialog visible in File > Open when the model is saved. |
Note: The density value can also be changed in the Measuring tool when Measuring Data.
A Center of Gravity button  is displayed in the parameters area.
This button displays the following information dialog showing center of gravity data:
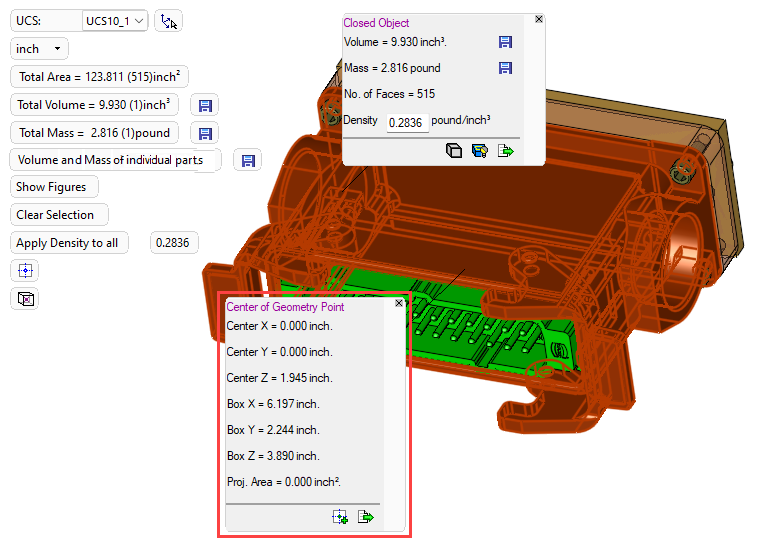
As with the Center of Geometry information dialog, the Center of Gravity information dialog enables you to create a point at the center of gravity of the picked object by pressing the ![]() button.
button.
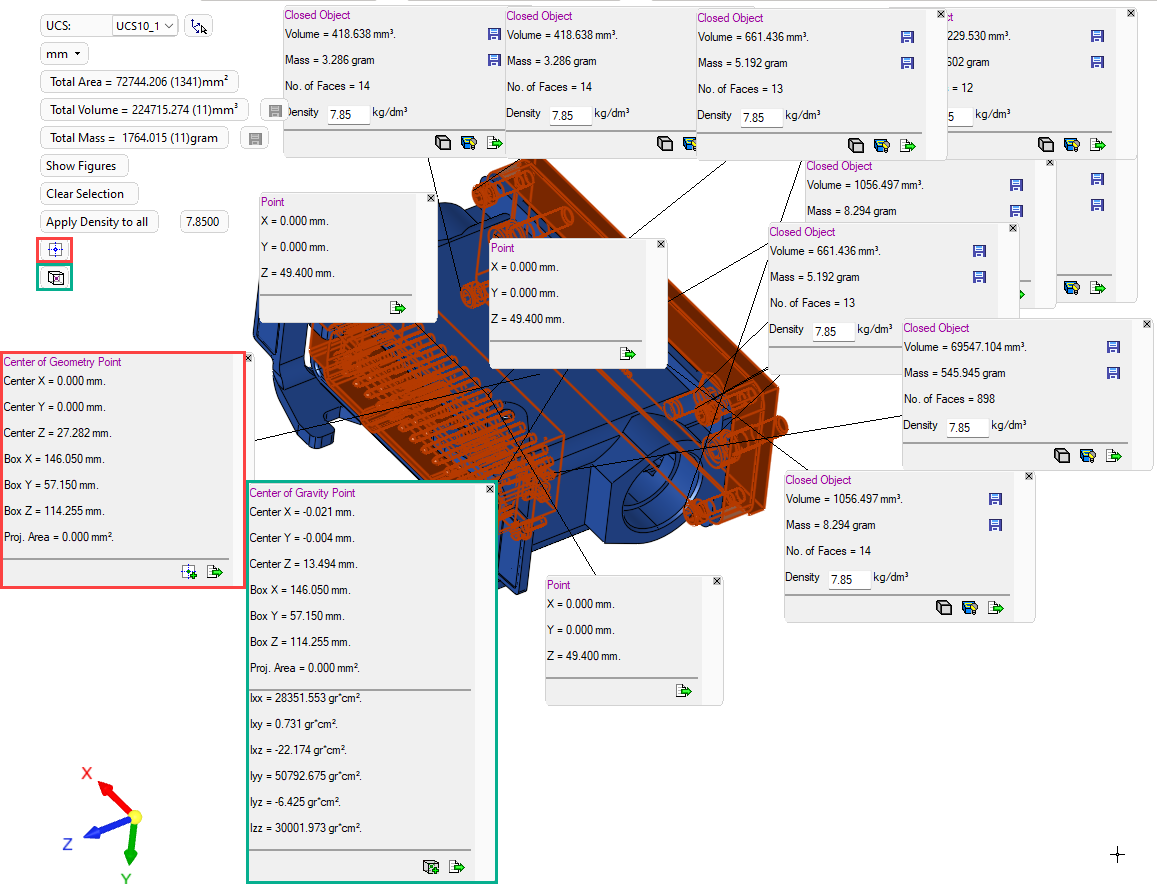
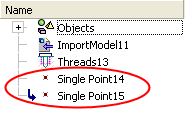
The points created by the Center of Geometry and Center of Gravity tools appear in the Feature Tree as follows:
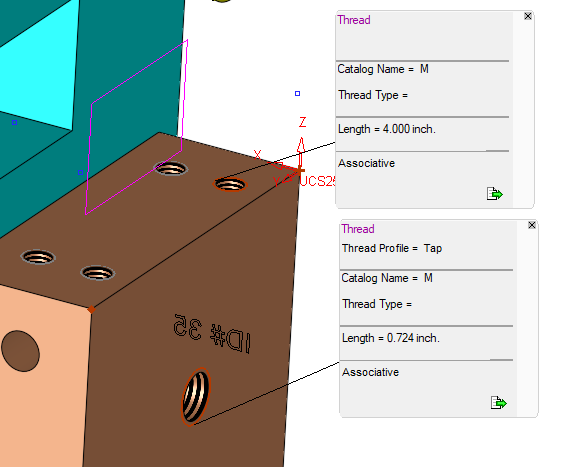
Thread Information
Thread information is also displayed in the Information Tool, such as catalog name, thread type (tap/screw), and the length of thread diameter.
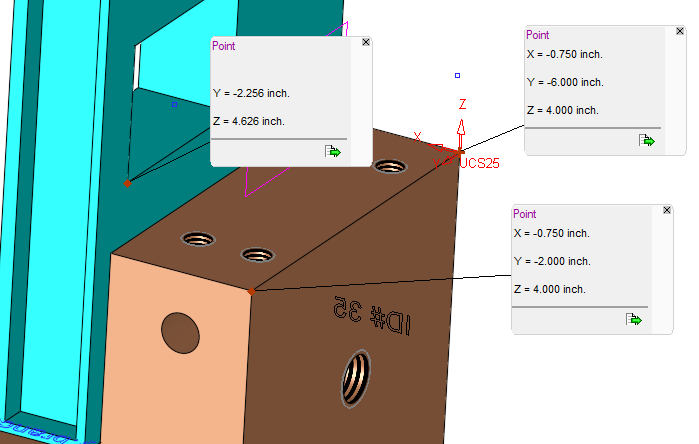
Points
If multiple points (and no other entity types) are selected, an export to CSV text file button ![]() is displayed in the parameters area. This additional button enables you to export the displayed information on all the selected points to a CSV text file. (The
is displayed in the parameters area. This additional button enables you to export the displayed information on all the selected points to a CSV text file. (The ![]() in each figure enables you to export the displayed information specific to that figure).
in each figure enables you to export the displayed information specific to that figure).
The point information is created according to the active UCS.
|